NextDose: A web-based Bayesian dose
forecasting tool
Last updated 15 January 2026
Busulfan
Target Concentration
TCI for
busulfan is usually used as part of conditioning for bone marrow transplant.
The conditioning aims to remove existing host stem cells so that transplanted
stem cells can be grafted and form new cells. Initial exposure-response studies
of busulfan led to an average steady state target of 0.77 mg/L (Bolinger,
Zangwill et al. 2000). This is equivalent to an AUC over
a 6 h dosing interval of 1125 umol/L*min which is the target recommended in the
FDA label (PDL 2006) for busulfan used for bone marrow
conditioning.
Busulfan is
an alkylating agent which is thought to bind irreversibly to DNA thereby
causing cell damage and death. This irreversible action would explain why the
cumulative exposure during treatment would be a predictor of cell kill and thus
bone marrow ablation. Thus the exposure target for busulfan is the cumulative
AUC over the standard treatment period of 4 days. The AUC with a constant rate
infusion over 4 days approaching a steady state concentration of 0.77 mg/L
would be 74 mg/L*h.
A
subsequent analysis proposed an acceptable range for a 4 day cumulative AUC of
78 to 101 mg/L*h (Bartelink,
Lalmohamed et al. 2016). The middle of that acceptable
range is 89.5 mg/L*h (usually rounded up to 90 mg/L*h) which is the target
exposure equivalent to 0.94 mg/L average steady state concentration.
A 2 day
cumulative AUC of 16.8 mg/L (equivalent to 0.35 mg/L average steady state) has
been proposed for bone marrow conditioning for Fanconi anemia (Mehta, Emoto et
al. 2019).
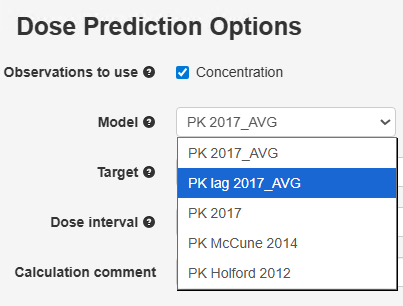
A dosing
strategy for busulfan is to aim for a steady state average target of 0.94 mg/L
with the target type option “Css avg mg/L” then measure concentrations after
the first busulfan dose (Figure 1).
The predictive
performance of NextDose for doses required to reach a target cumulative AUC has
been evaluated and shown
to have acceptable bias and precision (Lawson,
Paterson et al. 2021).
“Both software tools utilising Bayesian methods provided acceptable relative bias and precision of cumulative exposure estimations under the tested sampling scenarios. Relative bias ranged from median RE of 0.1–14.6% using InsightRX and from 3.4–7.8% using NextDose. Precision ranged from median RMSE of 0.19–0.32 mg·h·L−1 for InsightRX and 0.08–0.1 mg·h·L−1 for NextDose.”
The authors note that the bias of the Bayesian dosing methods is based on comparison with a non-compartmental (NCA) method for calculating AUC. The NCA methods are known to be biased (~10%) which means the Bayesian dose predictions are probably more reliable (Bartelink, Lalmohamed et al. 2016).
Figure 1 Dose prediction options with Css avg selected

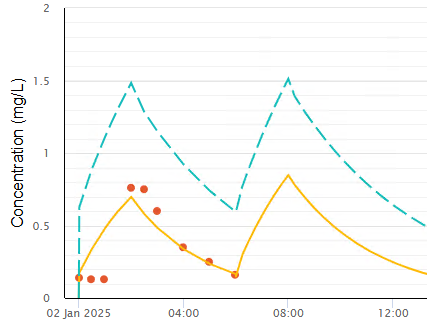
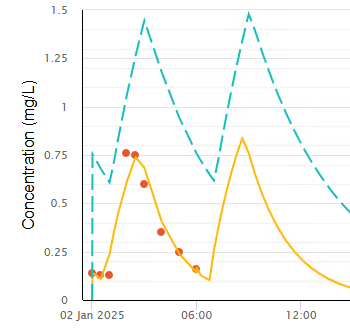
The time
course of observed busulfan concentrations after a single dose of 90 mg are
shown with NextDose predictions in Figure 2.
Figure 2 NextDose busulfan observed and predicted concentrations

The
proposed dose to achieve an average steady state target of 0.94 mg/L is 233
mg/day (Figure 3).
Figure 3 NextDose Results with average steady state target concentration

The
NextDose proposed dose with a 24 h dosing interval can be multiplied by 4 to
predict the total dose required. Subsequent measurements of busulfan can be
used to refine the daily dose requirement and subsequent doses calculated from
the predicted 4 day total dose minus those already given.
An
alternative method is to use a cumulative AUC target type e.g. “mg/L*h (4 day
cum AUC)” with a target value such as 90 mg/L*h (Figure 4).
Figure 4 Dose prediction options with 4 day cum AUC selected

You may
choose any dosing interval that is appropriate e.g. 24 h and NextDose will
propose doses for that dosing interval which will achieve the cumulative AUC
target of 90 mg/L*h. Because of the known decrease in busulfan clearance with
time after starting treatment only the next dose is proposed. Further doses
require repeated use of NextDose with the previously proposed dose. See example
below Figure 5.
If the time
remaining before the end of the cumulative AUC interval is less than 1.25 x the
dosing interval a single final dose will be proposed. Otherwise the remaining
dose to achieve the cumulative target will be divided among the remaining
dosing intervals in the remaining time.
An example
of using the cumulative AUC target is shown in Figure 5. It shows the AUC as a % of the
cumulative target AUC (8.64%). The AUC% value is estimated using between
occasion variability. This is followed by the proposed dose of 303 mg given
once a day and the predicted remaining % of target exposure after this first
dose (91.4%).
The
cumulative AUC table (Table 1) provides more information to help understand how
each dose is calculated for a cumulative AUC target. This table replaces the
predicted dose table used with other target types.
Table 1 Meaning of variables listed in the
cumulative AUC table
|
Column |
Meaning |
|
Tdose |
Time of dose (h) relative to first dose |
|
T+DI |
Tdose plus dosing interval (h) |
|
AMTcum |
Cumulative dose (total amount given) |
|
AUCcum |
Cumulative AUC from 0 to infinity from all
doses |
|
AUCdose |
AUC from 0 to infinity from the dose at Tdose |
|
AUC% |
% contribution of AUCdose to the cumulative
target AUC |
|
Drem |
Total remaining dose predicted to achieve the
cumulative target AUC |
|
Dnext |
Next dose predicted to achieve the cumulative
target AUC |
|
Trem |
Time remaining until the end of the
cumulative target AUC period |
|
AUCrem |
AUC remaining from 0 to infinity to achieve
the cumulative target AUC |
|
CL(T) |
Clearance using estimated BSV and BOV at
Tdose (if not AVG model) |
|
CLavg |
Clearance using estimated BSV at Tdose |
Figure 5 NextDose Results with cumulative AUC target

Note that
the proposed dose of 304 mg is based on the assumption that clearance will
remain unchanged. The McCune model for busulfan includes a time varying change
in clearance, therefore, it is recommended to repeat the NextDose calculation
for each of the proposed doses. This is illustrated in the following sequence
of figures.
Figure 6 Predicted time course and proposed doses of 273 mg following the second dose of 304 mg.


Figure 7 Predicted time course and proposed final dose of 266 mg following the third dose of 273 mg.


Figure 8 Predicted time course following the fourth dose of 266 mg which is within 1% of the target.


Note how the proposed dose decreased with time reflecting the decrease in busulfan clearance that has been reported over this time period (McCune, Bemer et al. 2014).
NextDose Model
The
NextDose pharmacokinetic model is based on (McCune, Bemer
et al. 2014). This is a large study including
infants to elderly adults. It accounts for body size and composition using fat
free mass, maturation of clearance in infants and a small decrease in clearance
over 4 days of treatment.
Dead Space Lag Time
Arrival of
drug into the central compartment after the start of a constant rate intravenous
infusion is typically delayed due to the dead space volume between the drug
infusion source and delivery of fluid into the bloodstream. In adults this typically
ignorable but in neonates it may take an hour before drug reaches the blood.
The example in Figure 9 is taken from an actual patient after
several previous doses of busulfan. This reveals 3 concentration measurements
taken at the start of the infusion showing a slow decline from previous doses.
The next concentrations are after busulfan has reached the blood. The model
without a deadspace lagtime is a poor fit to the observed concentrations.
Figure 9 Unmodelled lag time due to dead
space in a neonate
The PK lag
time 2017_AVG model may be used to account for the dead space volume.
Figure 10 Selection of the PK lag time 2017_AVG model
By adding Dead
Space Volume (10 mL) and the busulfan Fluid Conc (0.5 mg/L) observations using
the Doses and Observations page, this model can estimate the lag time due to
the dead space with much improved fit to the observed concentrations (Figure
11).
Figure 11 Modelled lag time due to dead space
in a neonate
Thanks to Dr
Laila Nassar, Rambam Hospital, Israel, for providing this example and helping
to develop the PK lag model.
Oral Absorption
The model
parameters used to describe oral dosing with busulfan have been changed based
on the work reported by Hassan (Hassan,
Ljungman et al. 1994). The previous busulfan model assumed
first-order absorption without lag time, rate constant (KA=1/h), complete oral
bioavailability (Foral=1) and no between subject variability. The Hassan study
reported individual estimates of KA, Tlag and Foral from 17 patients. They
reported an age associated difference in the extent of bioavailability when categorized
as adults and children. Using age as a continuous variable, extracted from in
their published data, provided little support for this distinction. The linear correlation
between age and bioavailability was 29%. Removal of one outlier value in a
child decreased the trend with a remaining correlation of 17%. The parameter values
used in NextDose are based on the average of adult and children combined with population
estimates of Tlag=0.41, KA=6.43 /h and Foral=0.78 (Foral outlier removed) and between
subject variability (square root of omega) of Tlag=93%, KA=73%, Foral=29% (Foral
outlier removed).
References
Bartelink, I. H., A. Lalmohamed, E. M. van Reij, C. C. Dvorak, R. M. Savic, J. Zwaveling, R. G. Bredius, A. C. Egberts, M. Bierings, M. Kletzel, P. J. Shaw, C. E. Nath, G. Hempel, M. Ansari, M. Krajinovic, Y. Theoret, M. Duval, R. J. Keizer, H. Bittencourt, M. Hassan, T. Gungor, R. F. Wynn, P. Veys, G. D. Cuvelier, S. Marktel, R. Chiesa, M. J. Cowan, M. A. Slatter, M. K. Stricherz, C. Jennissen, J. R. Long-Boyle and J. J. Boelens (2016). "Association of busulfan exposure with survival and toxicity after haemopoietic cell transplantation in children and young adults: a multicentre, retrospective cohort analysis." Lancet Haematol 3(11): e526–e536.
Bolinger, A. M., A. B. Zangwill, J. T. Slattery, D. Glidden, K. DeSantes, L. Heyn, L. J. Risler, B. Bostrom and M. J. Cowan (2000). "An evaluation of engraftment, toxicity and busulfan concentration in children receiving bone marrow transplantation for leukemia or genetic disease." Bone Marrow Transplant 25(9): 925–930.
Hassan, M., P. Ljungman, P. Bolme, O. Ringden, Z. Syruckova, A. Bekassy, J. Stary, I. Wallin and N. Kallberg (1994). "Busulfan bioavailability." Blood 84(7): 2144–2150.
Lawson, R., L. Paterson, C. J. Fraser and S. Hennig (2021). "Evaluation of two software using Bayesian methods for monitoring exposure and dosing once-daily intravenous busulfan in paediatric patients receiving haematopoietic stem cell transplantation." Cancer Chemotherapy and Pharmacology.
McCune, J. S., M. J. Bemer, J. S. Barrett, K. Scott Baker, A. S. Gamis and N. H. G. Holford (2014). "Busulfan in Infant to Adult Hematopoietic Cell Transplant Recipients: A Population Pharmacokinetic Model for Initial and Bayesian Dose Personalization." Clinical Cancer Research 20(3): 754–763.
Mehta, P. A., C. Emoto, T. Fukuda, B. Seyboth, A. Teusink-Cross, S. M. Davies, J. Wilhelm, K. Fuller, A. A. Vinks and F. Boulad (2019). "Busulfan Pharmacokinetics and Precision Dosing: Are Patients with Fanconi Anemia Different?" Biol Blood Marrow Transplant 25(12): 2416–2421.
PDL (2006). "Busulfex Product Label http://www.ivbusulfex.com/Busulfex_Marketing.Pi.8.06.pdf."
Copyright All rights
reserved | Developed by Sam Holford & Nick Holford 2012-2026